Selling Tips

Weekly Calgary Real Estate Update For January 29/ 2024

Weekly Calgary Real Estate Update For January 29/ 2024

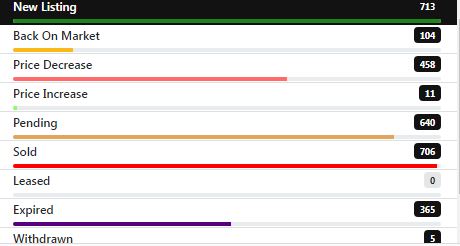
2965 homes for sale in metro Calgary (down 41)

1520 homes sold in the last 30 days (up 312)

1.95 months worth of inventory (down 0.54)

51.26% of the homes statistically to sell in the next 30 days (up 11.07%)

Market Conditions: Seller’s Market

Average List Price: $571,052 (up $4,727)

Average Sale Price: $567,103 (up $8,589)

Average days on market: 37 (down 2)

Average list to sale price ratio : 99.52% (up 0.32%)

*Numbers in the brackets are a comparison from last week’s stats. Ideally, we want the number of homes selling in the last 30 days to increase weekly, the months of inventory to decrease (meaning demand is matching inventory) and the % of homes to sell in the next 30 days to increase.
Weekly Calgary Real Estate Update For January 22/ 2024

Weekly Calgary Real Estate Update For January 22/ 2024

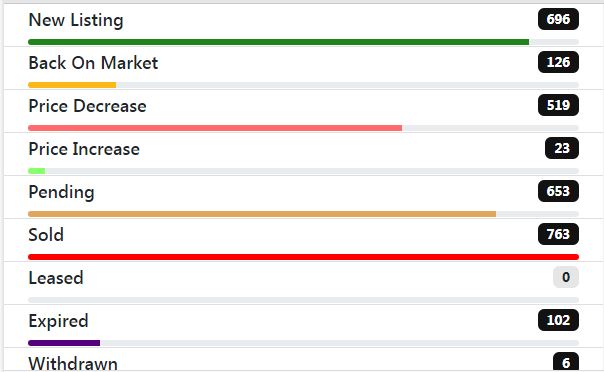
3006 homes for sale in metro Calgary (up 18)

1208 homes sold in the last 30 days (down 67)

2.49 months worth of inventory (down 0.13)

40.19% of the homes statistically to sell in the next 30 days (up 2.00%)

Market Conditions: Seller’s Market

Average List Price: $566,325 (up $5,848)

Average Sale Price: $558,474 (up $7,691)

Average days on market: 39 (same)

Average list to sale price ratio : 99.20% (up 0.36%)

*Numbers in the brackets are a comparison from last week’s stats. Ideally, we want the number of homes selling in the last 30 days to increase weekly, the months of inventory to decrease (meaning demand is matching inventory) and the % of homes to sell in the next 30 days to increase. **These numbers are reflecting the slow down around Christmas and the market will regain momentum again quickly**

Weekly Calgary Real Estate Update For January 15/ 2024

Weekly Calgary Real Estate Update For January 15/ 2024

2988 homes for sale in metro Calgary (up 51)

1141 homes sold in the last 30 days (down 31)

2.62 months worth of inventory (up 0.11)

38.19% of the homes statistically to sell in the next 30 days (down 1.21%)

Market Conditions: Seller’s Market

Average List Price: $560,477 (down $822)

Average Sale Price: $550,783 (down $260)

Average days on market: 39 (up 1)

Average list to sale price ratio : 98.84% (up 0.03%)

*Numbers in the brackets are a comparison from last week’s stats. Ideally, we want the number of homes selling in the last 30 days to increase weekly, the months of inventory to decrease (meaning demand is matching inventory) and the % of homes to sell in the next 30 days to increase. **These numbers are reflecting the slow down around Christmas and the market will regain momentum again quickly**

Weekly Calgary Real Estate Update For January 8/ 2024

Weekly Calgary Real Estate Update For January 8/ 2024

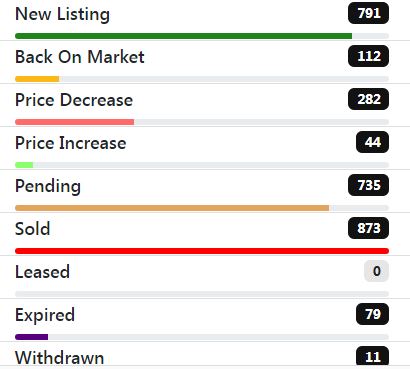
2937 homes for sale in metro Calgary (up 105)

1172 homes sold in the last 30 days (down 122)

2.51 months worth of inventory (up 0.32)

39.40% of the homes statistically to sell in the next 30 days (down 6.29%)

Market Conditions: Seller’s Market

Average List Price: $561,359 (up $3,874)

Average Sale Price: $551,043 (up $3,140)

Average days on market: 38 (up 3)

Average list to sale price ratio : 98.81% (up 0.53%)

*Numbers in the brackets are a comparison from last week’s stats. Ideally, we want the number of homes selling in the last 30 days to increase weekly, the months of inventory to decrease (meaning demand is matching inventory) and the % of homes to sell in the next 30 days to increase.
Weekly Calgary Real Estate Update For January 2/ 2024

Weekly Calgary Real Estate Update For January 2/ 2024

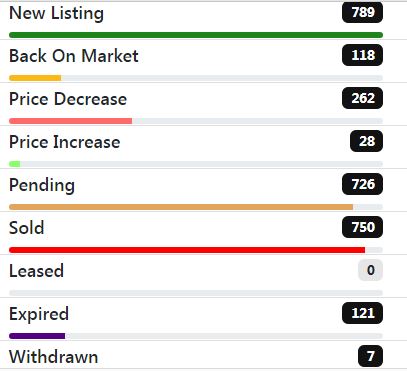
2832 homes for sale in metro Calgary (down 321)

1294 homes sold in the last 30 days (down 193)

2.19 months worth of inventory (up 0.07)

45.69% of the homes statistically to sell in the next 30 days (down 1.47%)

Market Conditions: Seller’s Market

Average List Price: $557,485 (up $7,986)

Average Sale Price: $547,903 (up $5,793)

Average days on market: 35 (up 1)

Average list to sale price ratio : 98.28% (down 0.38%)

*Numbers in the brackets are a comparison from last week’s stats. Ideally, we want the number of homes selling in the last 30 days to increase weekly, the months of inventory to decrease (meaning demand is matching inventory) and the % of homes to sell in the next 30 days to increase.

Weekly Calgary Real Estate Update For December 25/ 2023

Weekly Calgary Real Estate Update For December 25/ 2023

3153 homes for sale in metro Calgary (down 360)

1487 homes sold in the last 30 days (down 130)

2.12 months worth of inventory (down 0.05)

47.16% of the homes statistically to sell in the next 30 days (down 1.13%)

Market Conditions: Seller’s Market

Average List Price: $549,499 (down $2,710)

Average Sale Price: $542,110 (down $3,196)

Average days on market: 34 (up 1)

Average list to sale price ratio : 98.66% (down 0.09%)

*Numbers in the brackets are a comparison from last week’s stats. Ideally, we want the number of homes selling in the last 30 days to increase weekly, the months of inventory to decrease (meaning demand is matching inventory) and the % of homes to sell in the next 30 days to increase.
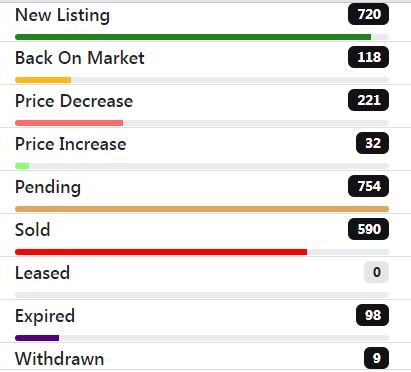
Weekly Calgary Real Estate Update For December 18/ 2023

Weekly Calgary Real Estate Update For December 18/ 2023

3513 homes for sale in metro Calgary (down 180)

1617 homes sold in the last 30 days (down 68)

2.17 months worth of inventory (down 0.02)

46.03% of the homes statistically to sell in the next 30 days (up 0.40%)

Market Conditions: Seller’s Market

Average List Price: $552,209 (up $10,283)

Average Sale Price: $545,306 (up $9,434)

Average days on market: 33 (up 2)

Average list to sale price ratio : 98.75% (down 0.13%)

*Numbers in the brackets are a comparison from last week’s stats. Ideally, we want the number of homes selling in the last 30 days to increase weekly, the months of inventory to decrease (meaning demand is matching inventory) and the % of homes to sell in the next 30 days to increase

Weekly Calgary Real Estate Update For December 11/ 2023

Weekly Calgary Real Estate Update For December 11/ 2023

3693 homes for sale in metro Calgary (down 37)

1685 homes sold in the last 30 days (down 55)

2.19 months worth of inventory (up 0.05)

45.63% of the homes statistically to sell in the next 30 days (down 1.02%)

Market Conditions: Seller’s Market

Average List Price: $541,926 (down $8,608)

Average Sale Price: $535,872 (down $7,793)

Average days on market: 31 (same)

Average list to sale price ratio : 98.88% (down 0.13%)

*Numbers in the brackets are a comparison from last week’s stats. Ideally, we want the number of homes selling in the last 30 days to increase weekly, the months of inventory to decrease (meaning demand is matching inventory) and the % of homes to sell in the next 30 days to increase

Weekly Calgary Real Estate Update For December 4/ 2023

Weekly Calgary Real Estate Update For December 4/ 2023

3730 homes for sale in metro Calgary (down 129)

1740 homes sold in the last 30 days (down 74)

2.14 months worth of inventory (up 0.01)

46.65% of the homes statistically to sell in the next 30 days (down 0.35%)

Market Conditions: Seller’s Market

Average List Price: $550,534 (up $4,532)

Average Sale Price: $543,665 (up $3,433)

Average days on market: 31 (same)

Average list to sale price ratio : 99.01% (down 0.26%)

*Numbers in the brackets are a comparison from last week’s stats. Ideally, we want the number of homes selling in the last 30 days to increase weekly, the months of inventory to decrease (meaning demand is matching inventory) and the % of homes to sell in the next 30 days to increase

Weekly Calgary Real Estate Update For November 27/ 2023

Weekly Calgary Real Estate Update For November 27/ 2023

3859 homes for sale in metro Calgary (down 86)

1814 homes sold in the last 30 days (down 80)

2.13 months worth of inventory (up 0.05)

47.00% of the homes statistically to sell in the next 30 days (down 1.01%)

Market Conditions: Seller’s Market

Average List Price: $546,002 (up $1,412)

Average Sale Price: $540,232(down $135)

Average days on market: 31 (same)

Average list to sale price ratio : 99.27% (down 0.23%)

*Numbers in the brackets are a comparison from last week’s stats. Ideally, we want the number of homes selling in the last 30 days to increase weekly, the months of inventory to decrease (meaning demand is matching inventory) and the % of homes to sell in the next 30 days to increase