
Blog

When The Bank Says No, You May Still Have Options…

Being turned down for a mortgage can leave you wondering whether your plans to buy a home or stay in the one you already own have reached a dead end. But a “no” from one bank doesn’t necessarily mean your homeownership journey is over.

Traditional lenders assess applications using set requirements for income, credit and debt. Those guidelines work for many borrowers, but they don’t always tell the whole story.

A self-employed borrower, for example, may have a successful business and steady cash flow while reporting a lower taxable income because of legitimate business deductions. Someone else may be rebuilding their credit after a job loss, illness, divorce or other difficult period that doesn’t reflect their current ability to manage a mortgage.

In these situations, the challenge may not be whether you can responsibly afford the mortgage. It may simply be finding a lender that takes the time to understand your circumstances and consider the full picture.

Looking beyond the standard application

As mortgage brokers, we work with a broad range of banks, credit unions and alternative lenders, each with its own products and approval criteria

Depending on your circumstances, potential options could include:Using alternative documentation to demonstrate self-employed incomeRestructuring or consolidating existing debtsIncreasing the down payment or adding a qualified co-borrowerChoosing a lender that takes a more flexible approach to credit historyUsing a short-term alternative mortgage while working toward traditional financingFor homeowners, these strategies may also provide a way to refinance pressing debts or remain in their home when their current lender is unable to offer a workable solution.

Because every option comes with trade-offs, it’s important to look beyond the immediate approval. Alternative mortgages can carry higher rates and fees, while debt consolidation may reduce monthly payments but extend the time needed to repay what you owe. The goal is to find a mortgage that makes financial sense for both your current circumstances and your longer-term plans.

A stepping stone, not necessarily a permanent solution

In some cases, an alternative mortgage can serve as a temporary bridge, providing time to rebuild your credit, establish a longer self-employment history, reduce debt or improve how your income is documented.

That makes the exit strategy just as important as the initial approval. Before proceeding, you should understand what needs to change, how long that process may take and what it will cost to move back to a traditional lender.

If your income or credit history has made you hesitant to apply, reach out to me before assuming you won’t qualify. I can review your circumstances, explain the options available and help you build a realistic path forward, even if the best approach is to wait and prepare a stronger application.

Barb Eglauer
Mortgage Agent
(780) 720-5185
barb.eglauer@mortgagegroup.com

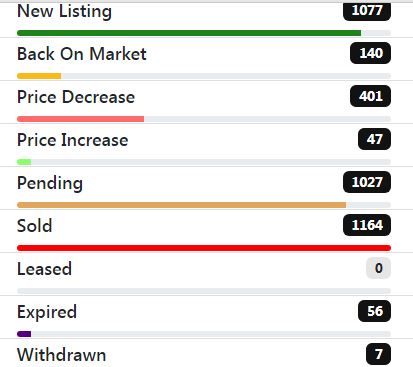
Weekly Calgary Real Estate Update For August 3/ 2026

Weekly Calgary Real Estate Update For August 3/ 2026

7642 homes for sale in metro Calgary (down 242)

1891 homes sold in the last 30 days (up 63)

4.04 months worth of inventory (down 0.27)

24.74% of the homes statistically to sell in the next 30 days (up 1.55%)

Market Conditions: Balanced Market

Average List Price: $645,602 (down $3,927)

Average Sale Price: $631,260 (down $4,231)

Average days on market: 43 (up 2)

Average list to sale price ratio : 97.78% (down 0.06%)

*Numbers in the brackets are a comparison from last week’s stats. Ideally, we want the number of homes selling in the last 30 days to increase weekly, the months of inventory to decrease (meaning demand is matching inventory) and the % of homes to sell in the next 30 days to increase.

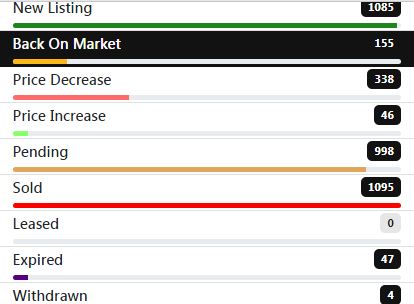
Weekly Calgary Real Estate Update For July 27/ 2026

Weekly Calgary Real Estate Update For July 27/ 2026

7884 homes for sale in metro Calgary (up 24)

1828 homes sold in the last 30 days (down 81)

4.31 months worth of inventory (up 0.19)

23.19% of the homes statistically to sell in the next 30 days (down 1.10%)

Market Conditions: Balanced Market

Average List Price: $649,529 (up $1,109)

Average Sale Price: $635,491 (down $151)

Average days on market: 41 (up 1)

Average list to sale price ratio : 97.84% (down 0.18%)

*Numbers in the brackets are a comparison from last week’s stats. Ideally, we want the number of homes selling in the last 30 days to increase weekly, the months of inventory to decrease (meaning demand is matching inventory) and the % of homes to sell in the next 30 days to increase.

Weekly Calgary Real Estate Update For July 20/ 2026

Weekly Calgary Real Estate Update For July 20/ 2026

7860 homes for sale in metro Calgary (up 84)

1909 homes sold in the last 30 days (down 85)

4.12 months worth of inventory (up 0.22)

24.29% of the homes statistically to sell in the next 30 days (down 1.35%)

Market Conditions: Balanced Market

Average List Price: $648,420 (down $19,262)

Average Sale Price: $635,642 (down $19,475)

Average days on market: 40 (up 2)

Average list to sale price ratio : 98.02% (down 0.10%)

*Numbers in the brackets are a comparison from last week’s stats. Ideally, we want the number of homes selling in the last 30 days to increase weekly, the months of inventory to decrease (meaning demand is matching inventory) and the % of homes to sell in the next 30 days to increase.

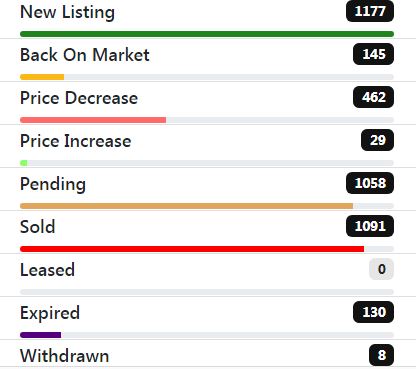
Weekly Calgary Real Estate Update For July 13/ 2026

Weekly Calgary Real Estate Update For July 13/ 2026

7776 homes for sale in metro Calgary (down 111)

1994 homes sold in the last 30 days (down 79)

3.90 months worth of inventory (up 0.10)

25.64% of the homes statistically to sell in the next 30 days (down 0.64%)

Market Conditions: Balanced Market

Average List Price: $667,682 (down $6,592)

Average Sale Price: $655,117 (down $7,196)

Average days on market: 38 (same)

Average list to sale price ratio : 98.12% (down 0.10%)

*Numbers in the brackets are a comparison from last week’s stats. Ideally, we want the number of homes selling in the last 30 days to increase weekly, the months of inventory to decrease (meaning demand is matching inventory) and the % of homes to sell in the next 30 days to increase.

Weekly Calgary Real Estate Update For July 6/ 2026

Weekly Calgary Real Estate Update For July 6/ 2026

7887 homes for sale in metro Calgary (down 274)

2073 homes sold in the last 30 days (down 131)

3.80 months worth of inventory (up 0.10)

26.28% of the homes statistically to sell in the next 30 days (down 0.72%)

Market Conditions: Balanced Market

Average List Price: $674,274 (down $8,335)

Average Sale Price: $662,313 (down $9,342)

Average days on market: 38 (up 1)

Average list to sale price ratio : 98.22% (down 0.18%)

*Numbers in the brackets are a comparison from last week’s stats. Ideally, we want the number of homes selling in the last 30 days to increase weekly, the months of inventory to decrease (meaning demand is matching inventory) and the % of homes to sell in the next 30 days to increase.
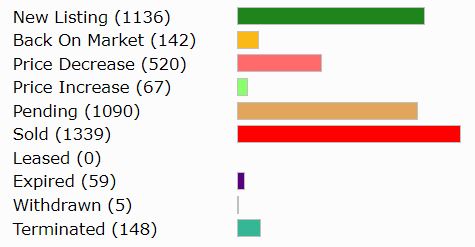
Weekly Calgary Real Estate Update For June 29/ 2026

Weekly Calgary Real Estate Update For June 29/ 2026

8161 homes for sale in metro Calgary (up 51)

2204 homes sold in the last 30 days (down 26)

3.70 months worth of inventory (up 0.06)

27.00% of the homes statistically to sell in the next 30 days (down 0.50%)

Market Conditions: Balanced Market

Average List Price: $682,609 (down $11,197)

Average Sale Price: $671,655 (down $10,679)

Average days on market: 37 (up 1)

Average list to sale price ratio : 98.40% (up 0.05%)

*Numbers in the brackets are a comparison from last week’s stats. Ideally, we want the number of homes selling in the last 30 days to increase weekly, the months of inventory to decrease (meaning demand is matching inventory) and the % of homes to sell in the next 30 days to increase.

Weekly Calgary Real Estate Update For June 22/ 2026

Weekly Calgary Real Estate Update For June 22/ 2026

8110 homes for sale in metro Calgary (up 90)

2230 homes sold in the last 30 days (up 51)

3.64 months worth of inventory (down 0.04)

27.50% of the homes statistically to sell in the next 30 days (up 0.33%)

Market Conditions: Balanced Market

Average List Price: $693,806 (up $9,736)

Average Sale Price: $682,334 (up $9,711)

Average days on market: 36 (same)

Average list to sale price ratio : 98.35% (up 0.03%)

*Numbers in the brackets are a comparison from last week’s stats. Ideally, we want the number of homes selling in the last 30 days to increase weekly, the months of inventory to decrease (meaning demand is matching inventory) and the % of homes to sell in the next 30 days to increase.
Weekly Calgary Real Estate Update For June 15/ 2026

Weekly Calgary Real Estate Update For June 15/ 2026

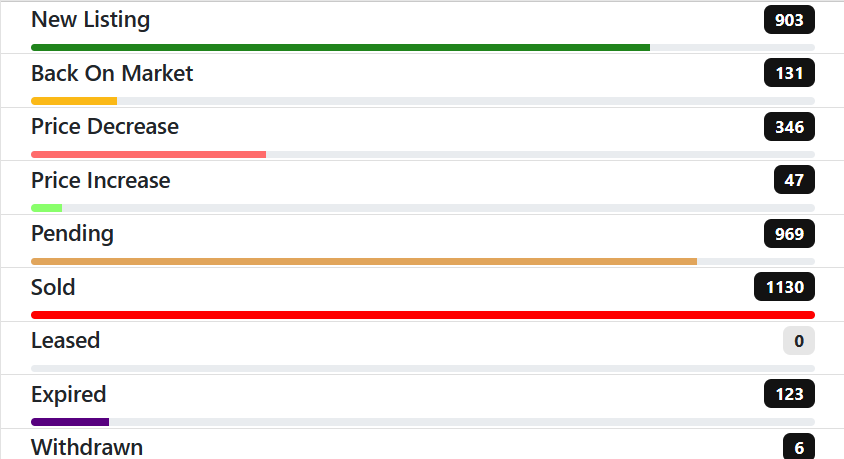
8020 homes for sale in metro Calgary (up 175)

2179 homes sold in the last 30 days (up 10)

3.68 months worth of inventory (up 0.06)

27.17% of the homes statistically to sell in the next 30 days (down 0.48%)

Market Conditions: Balanced Market

Average List Price: $684,070 (down $11,312)

Average Sale Price: $672,623 (down $11,311)

Average days on market: 36 (up 1)

Average list to sale price ratio : 98.33% (down 0.02%)

*Numbers in the brackets are a comparison from last week’s stats. Ideally, we want the number of homes selling in the last 30 days to increase weekly, the months of inventory to decrease (meaning demand is matching inventory) and the % of homes to sell in the next 30 days to increase.
Weekly Calgary Real Estate Update For June 8/ 2026

Weekly Calgary Real Estate Update For June 8/ 2026

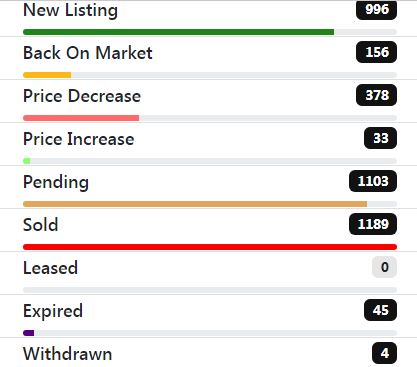
7845 homes for sale in metro Calgary (up 119)

2169 homes sold in the last 30 days (up 55)

3.62 months worth of inventory (down 0.03)

27.65% of the homes statistically to sell in the next 30 days (up 0.29%)

Market Conditions: Balanced Market

Average List Price: $695,382 (up $15,612)

Average Sale Price: $683,934 (up $14,730)

Average days on market: 35 (down 1)

Average list to sale price ratio : 98.35% (down 0.10%)

*Numbers in the brackets are a comparison from last week’s stats. Ideally, we want the number of homes selling in the last 30 days to increase weekly, the months of inventory to decrease (meaning demand is matching inventory) and the % of homes to sell in the next 30 days to increase.